Average Calculator
The Average Calculator tool allows you to calculate the average (mean) of a set of numbers quickly and accurately. This tool is perfect for students, teachers, analysts, and anyone who needs to find the average value of data sets for academic, professional, or personal purposes. The process is simple and efficient, providing clear and precise results.
Share on Social Media:
Efficient Average Calculator: Simplify Your Data Analysis
Calculating an average has never been easier. The average calculator swiftly determines mean values, essential for students’ grades, data analysis, and beyond. Our guide unpacks how to use this indispensable tool, ensuring your calculations are both accurate and efficient.
Key Takeaways
The Average Calculator by PagesTools.com is a user-friendly, dynamic tool capable of handling up to 50 numbers, designed to efficiently compute mean values and enhance productivity in both educational and professional settings.
While the Average Calculator facilitates real-time mean calculations, it also has the capability to perform more nuanced computations, such as weighted averages, to suit different data analysis needs.
Despite the ease of use of the Average Calculator, understanding the context and characteristics of data (like outliers and skewed distribution) is essential for choosing the right measures of central tendency (mean, median, mode) and achieving accurate analysis of data sets.
Understanding the Average Calculator by PagesTools.com
The Average Calculator by PagesTools.com is an online tool designed to find the average of a set of numbers quickly and efficiently. This calculator was born out of the need to develop a streamlined, intuitive tool that simplifies the calculation of averages. So, whether you’re a student trying to calculate your exam scores or a data analyst sifting through piles of numbers, this tool is your go-to solution.
The user-friendly interface of the Average Calculator allows you to input multiple numbers, separated by commas, to determine their mean value. The calculator’s functionality allows users to compute the mean value from a set of numbers swiftly, making data analysis a breeze. But how does it do that? Let’s explore the key features of the Average Calculator.
Key Features of the Average Calculator
The Average Calculator is designed to be dynamic and adaptable. After entering the eighth entry, the interface automatically provides new entry fields to accommodate additional data points. With the capacity to handle up to 50 numbers, this tool is designed to manage various data set sizes, adapting its entry fields as needed.
As you enter values, you can observe how the mean changes in real-time with each new data input. The calculator also streamlines the calculation process by updating the calculated average automatically after each new data entry, negating the need for a separate calculate button.
Advantages of Using the Average Calculator
The Average Calculator is more than just a tool to find the arithmetic mean; it’s a powerful ally in data analysis and education. It simplifies the process of data analysis by enabling quick and efficient calculation of averages.
In educational settings, it’s an invaluable tool for both students and teachers for computing averages for grades and analyzing test scores. Professional data analysts can also leverage this tool to obtain instant insights from complex data sets, streamlining analysis sessions, and enhancing productivity.
Calculating the Mean: The Basics
While averages may seem like a straightforward concept, they are grounded in fundamental statistical theory. The term ‘average’ in mathematics is commonly understood to mean the arithmetic mean, a central concept in statistics. The arithmetic mean is a type of measure of central tendency, which is previewed in how the average represents a central value within a set of numbers.
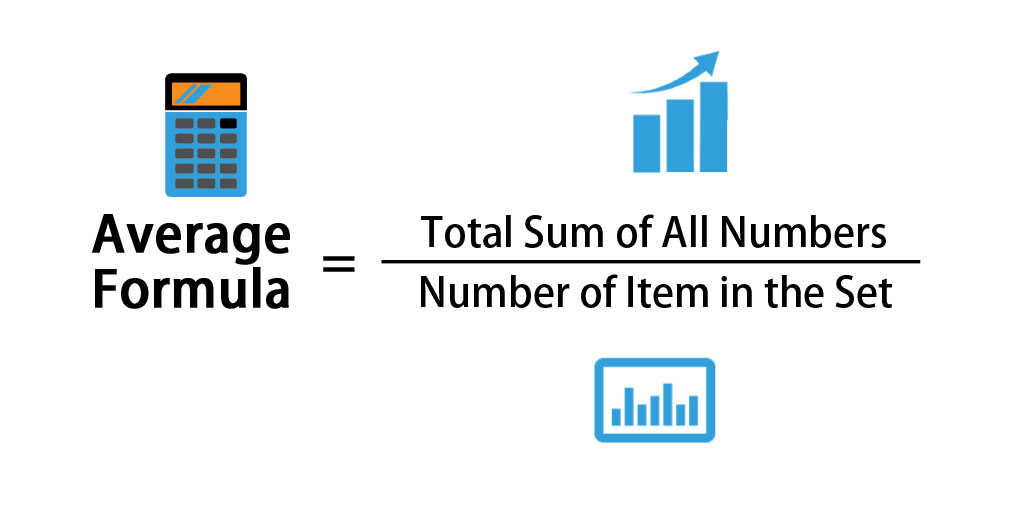
To find the mean or average, all numbers in a data set are summed up, then divided by the count of those numbers. The resulting value is the average, or mean, represented in the calculator as the sum of all entered values divided by the total number of values inputted. But what does this mean in actual practice? Let’s delve into the arithmetic mean more specifically.
Defining the Arithmetic Mean
The arithmetic mean is the simplest and most commonly used measure of an average. It’s calculated by summing all the values in a data set and then dividing by the total number of values. Serving as a measure of central tendency, it acts as a summary, representing the entirety of a group of numbers.
In statistical terms, the population mean, symbolized as ‘μ’, is computed using the sum of all scores in the population (‘Σ Xi’) divided by the total population size (‘N’). In contrast, the sample mean, represented by ‘x_bar’, uses the sum of sample scores (‘Σ xi’) divided by the sample size (‘n’).
Importance in Data Analysis
The average value plays a crucial role in data analysis. By summarizing large volumes of data with a single representative value, it allows for quick insights and comparisons at a glance. This succinct summary provided by the average value simplifies comparison and analysis, enhancing productivity and decision-making by providing instantaneous, clear insights into complex data sets.
For individuals like Mateusz, an average calculator enhances productivity and decision-making by providing instantaneous, clear insights into complex data sets. In various sectors, including education and business, average calculators are employed for tasks like evaluating economic trends, monitoring school performance, and guiding business decisions.
Step-by-Step Guide: How to Calculate the Average
Now, let’s get down to the nitty-gritty of calculating averages. Whether you’re doing it manually or using the Average Calculator, the steps remain the same. You start by adding all the values together. Next, count the total number of values, and then divide the sum by the count to manually calculate the average. This process can also be referred to as finding the numbers divided by the total count.
Online mean calculators go a step further, offering step-by-step solutions to problems, which increases transparency and trust in the tool’s results.
Entering Your Data Values
To calculate an average, the first step involves correctly entering your data values. For average calculation input, the user should separate data values with commas or new lines. After inputting the data, the user must click ‘Calculate’ to get the average along with a breakdown of the calculation.
The average calculator has the capacity to handle up to thirty numbers for calculating the average. However, it’s not mandatory for users to input the maximum number of values. Fewer entries can be used if needed.
Utilizing the Calculate Button
One of the best features of the Average Calculator is its automatic updates. That’s right; the calculator doesn’t require a ‘Calculate’ button to be pressed in order to compute the average as it updates automatically with each entry. However, if a user opts to manually utilize a ‘Calculate’ button, the calculator processes the inputs and outputs the average value along with a detailed breakdown of how the calculation was performed.
This combination of instant calculation and optional manual calculation enhances the efficiency and user-friendliness of the average calculation process.
Advanced Calculations: Weighted Average and More
While an average or mean value can provide a general sense of a data set, sometimes you need more nuanced calculations. That’s where the concept of a weighted average comes into play. A weighted average assigns different weights to each number, indicating its importance in the set.
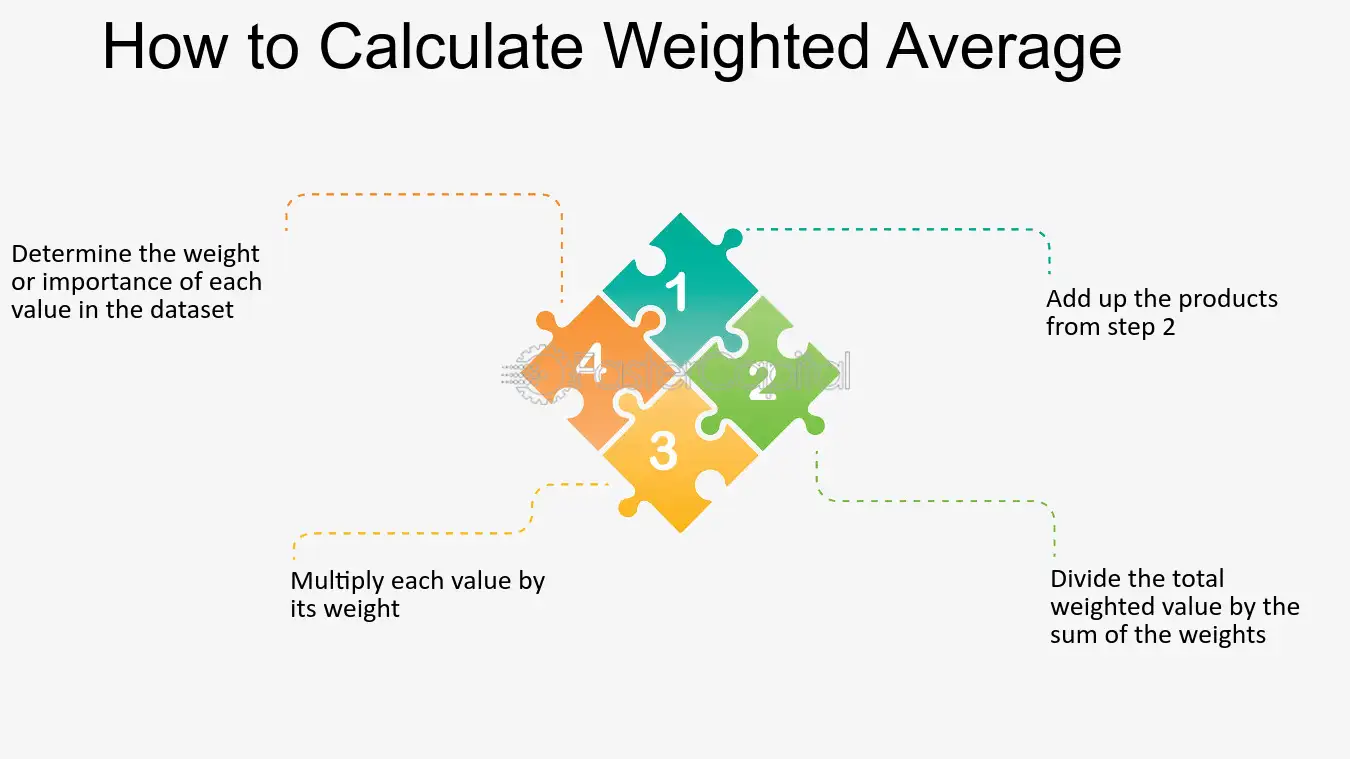
To calculate a weighted average, each value is multiplied by its weight, these products are then added together, and the sum is divided by the total of the weights.
Understanding Weighted Averages
Weighted averages are computed by giving different values in a data set distinct levels of importance through the assignment of weights. A weighted average is calculated by multiplying each data value by its corresponding weight, summing these products, and then dividing by the total sum of weights.
This understanding of weighted averages is crucial when merging datasets of different sizes to ensure the influence of each set on the overall average is proportional to its size.
Applying Weights to Your Data Set
Applying weights to your given data set for a weighted average calculation involves a few steps. First, both the data values and their corresponding weights need to be inputted into the calculator. The weights indicate how many times each value occurs or its importance in the set, which must be provided alongside the data values to determine the weighted average.
Then, each value in the data set is multiplied by its corresponding weight. The results are summed and then divided by the total weight to find the weighted average.
Common Uses of Average Calculators
Average calculators have a wide range of applications, from academic environments to professional data analysis. In academic settings, they can be used for determining students’ grades and analyzing test scores. On the other hand, in professional settings, average calculators can prevent errors when merging data sets by ensuring accurate averaging of combined values.
Let’s explore the common uses of average calculators in more detail.
In Academic Settings
In academic settings, average calculators are indispensable tools. They facilitate the calculation of students’ grades, incorporating standard average calculations as well as complex weighted average scenarios where varying weights are attributed to assignments, tests, and exams.
Students also use average calculators to sum up their scores across different subjects and assignments, allowing them to compare their academic performance with that of their peers.
For teachers, these calculators are utilized to compute the mean of a class’s test scores, enabling them to perform a quick review of the students’ collective academic achievements.
For Professional Data Analysts
For professional data analysts, average calculators are powerful tools that simplify data analysis by enabling swift and precise computations for extensive data volumes. These calculators enhance efficient decision making by rapidly procuring accurate mean values from the data.
In finance, the arithmetic mean is crucial for calculating average metrics such as mean earnings estimates or average stock closing prices over specific periods. Whether it’s for managing stock portfolios or handling complex datasets, the adept handling of large data sets for quick, precise average calculations underscores the indispensable value of average calculators to the work of professional data analysts.
Exploring Other Types of Averages
While the arithmetic mean or average is the most commonly used measure of central tendency, it’s not the only one. The mean, median, and mode are the three main measures of central tendency. They are used to describe the typical value of a dataset. Each of these measures can provide unique insights into your data, depending on its distribution and the presence of outliers.
Let’s take a closer look at the other types of averages.
Median: Finding the Middle Value
In skewed datasets, the median serves as a better measure of central tendency than the mean because it is less influenced by extreme values. The median is the middle number in a set of middle values arranged in ascending order. Unlike the mean, it is not affected by extreme outliers, making it a more robust measure in certain cases.
Mode: The Most Frequent Number
The mode is another important measure of central tendency. It is the value in a data set that has the highest number of repetitions, often identified as the most frequent number in a list of values. Identifying the mode is beneficial in assessing the most common data points within a dataset, providing insights that other measures of central tendency might miss.
In practical scenarios, such as determining the most popular product in a grocery store, more than one mode can guide stocking decisions and inventory management.
Range: Understanding Data Spread
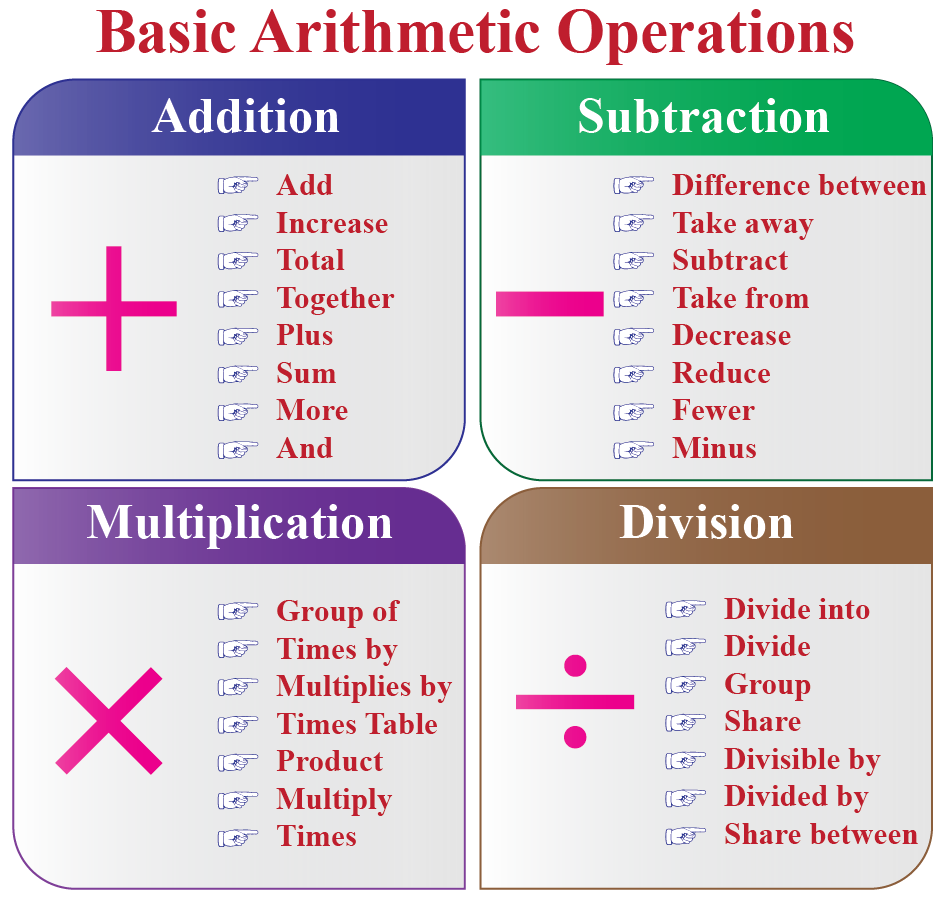
The range is yet another useful statistical measure. It’s the difference between the largest and smallest values in a data set, highlighting the spread in the data. Extreme values, known as outliers, can significantly affect the range of a data set by expanding or contracting the spread of the data.
Hence, proper analysis and accounting for outliers are crucial when calculating the range to ensure an accurate understanding of data variability.
Addressing Common Misconceptions
Even with a clear understanding of averages and their calculation, misconceptions can still arise. For example, averages can be misleading because they best represent evenly distributed bell curves, but extreme points can dramatically change the average.
Moreover, the terms ‘average’, ‘typical’, and ‘common’ are often used interchangeably, but in statistics, they can represent different concepts, which may lead to misunderstandings.
Can You Average Averages?
One common misconception is that you can simply average averages. However, averaging already computed averages from different data sets without proper adjustment can result in inaccurate representations of the actual average. To combine calculated metrics accurately, one should deconstruct them into base metrics and recalculate the average using these unified raw numbers.
In the presence of outliers, the arithmetic mean may not represent the central tendency effectively, which is a consideration to be mindful of when averaging averages.
Mean vs. Median: Which Is Better?
Another common point of confusion is the question of whether the mean or median is better. The answer to this depends on the data set. The mean is well-suited for data that has a normal distribution and few outliers, while the median, which represents the two middle values in a data set, is better for skewed distributions as it reduces the impact of extreme values.
For data sets containing outliers, the median offers a more representative measure of central tendency, avoiding the skewing effect that outliers have on the mean.
Maximizing the Use of Average Calculators
To get the most out of the Average Calculator, start by inputting your numbers directly into the calculator. As more values are inputted into the Average Calculator, the interface dynamically expands to make it easier to manage and view larger datasets.
By following these simple steps, you can maximize the use of the Average Calculator and make your data analysis process more efficient and accurate.
Troubleshooting Common Issues
Despite the simplicity and ease of use of the Average Calculator, some common issues might arise. One such issue is incorrect user inputs, such as failing to enter monthly payments as a negative number, which can lead to unexpected calculation results. To avoid errors in calculations, users must ensure inflows and outflows are entered as positive and negative numbers respectively, as the calculator differentiates between the two.
Another important factor to consider is the matching of payment settings and the payment period. For correct calculation results, users need to verify that the payment settings match the payment period, with the ‘BGN’ setting adjusted if necessary.
By keeping these common issues in mind and troubleshooting them effectively, users can ensure accurate calculations and get the most out of the Average Calculator.
Navigating Privacy and Data Storage
When using an online tool like the Average Calculator, it’s important to be aware of privacy and data storage policies. PagesTools.com collects and processes various user data, including:
authentication-derived identifiers
users’ profiles
user-provided data
browsing and interaction data
This information is crucial to consider when using any online tool, as it ensures that you understand how your data is being handled and protected.
Enhancing Statistical Knowledge
By using the Average Calculator, users not only get the answers they need but also enhance their statistical knowledge and understanding. Mean calculators like the one provided by PagesTools.com enhance the learning process by providing visual representations of data that help students grasp and communicate the mathematics behind statistical concepts.
Whether you’re a student, a teacher, or a professional, using the Average Calculator can enhance your statistical knowledge and make data analysis a breeze.
Summary
In conclusion, the Average Calculator by PagesTools.com is a versatile and efficient tool for calculating averages, whether it’s the simple arithmetic mean or the more nuanced weighted average. It’s user-friendly and dynamic, accommodating up to 50 numbers and updating the average value in real-time with each entry. The calculator is invaluable in academic settings for calculating grades and test scores, and professional data analysts leverage it for instant insights from complex data sets. It’s also a great tool for enhancing statistical knowledge and understanding, making it a must-have tool for anyone dealing with data.
Frequently Asked Questions
How does the Average Calculator work?
The Average Calculator works by summing the input numbers and then dividing by the count to find the average.
Can the Average Calculator handle large data sets?
Yes, the Average Calculator can handle up to 50 numbers at a time, making it suitable for processing large data sets.
What is a weighted average?
A weighted average assigns different weights to data, reflecting their significance, and is calculated by multiplying each value by its weight, summing these products, and dividing by the total weights. This helps in considering the relative importance of different values in the dataset.
What is the difference between the arithmetic mean and the median?
The arithmetic mean is the sum of all numbers in a data set divided by the count of those numbers, while the median is the middle number in a set of values arranged in ascending order. The median is less influenced by extreme values, making it a better measure of central tendency for skewed distributions.
How can I maximize the use of the Average Calculator?
Maximize the use of the Average Calculator by inputting your numbers directly into the calculator, which dynamically expands the interface to manage and view larger datasets more easily.